Video Lecture

Theory For Making Notes

In physics we use two dimensional graphs to show the variation of one quantity with respect to other . While studying graphs in physics always keep few points in mind. Like

(1) A relation or equation is required to draw any graph.

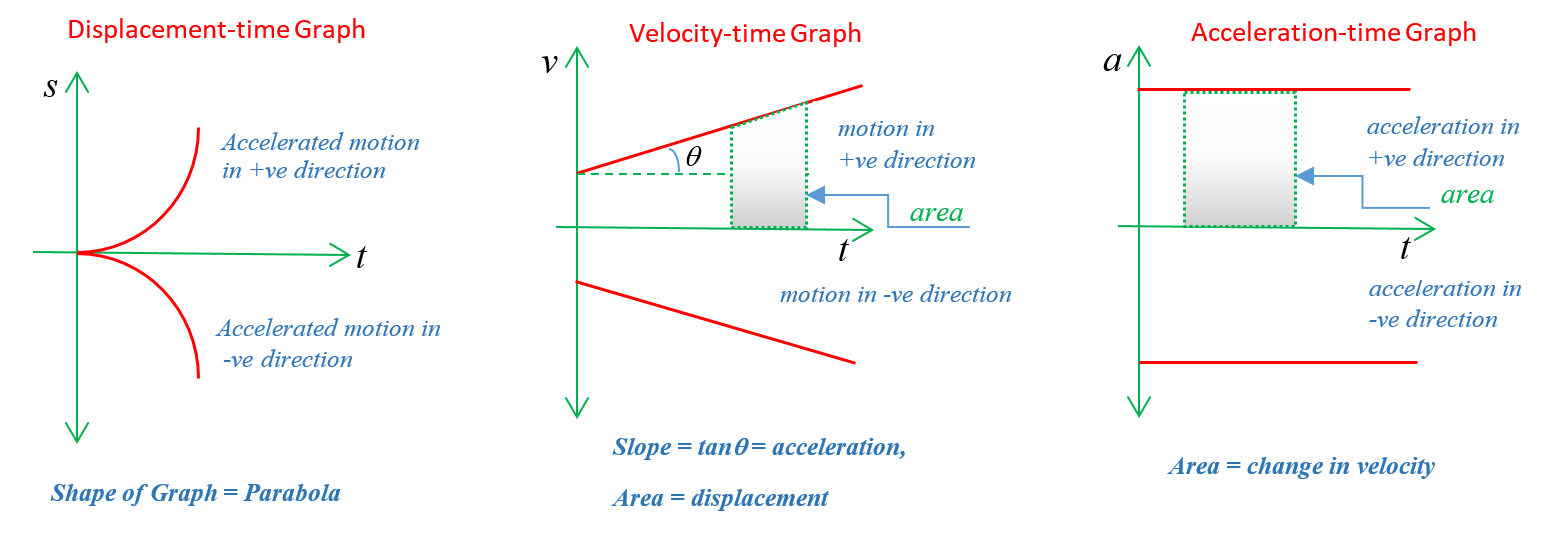
for example if we want to draw the velocity-time graph for a uniformly accelerated motion in a straight line we must have a equation between velocity and time for the given motion and that is v=u +at. So we make use of this equation to draw the graph

(2) Choose the proper coordinate axis for the two quantities

For example while using v = u + at to draw the v-t graph, decide first that v should be taken on x axis or y axis.

Normally the dependent quantity ( in this case v) is taken on y axis and independent quantity ( in this case t) is taken on x axis

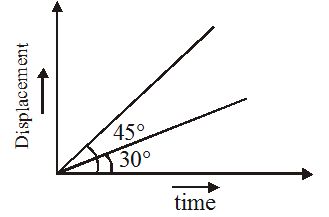
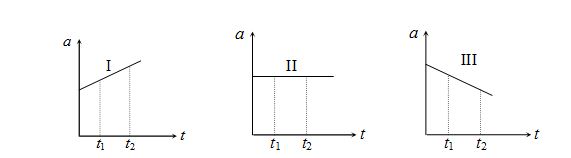
(3) Every graph has a slope. So always try to find that what the slope of the graph represents

For example the slope of any graph is given by \displaystyle \frac{{dy}}{{dx}}, so in our example of v-t graph it is given by \displaystyle \frac{{dv}}{{dt}} which is nothing but acceleration.

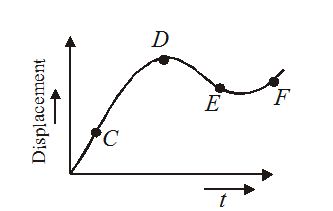
In many graphs the slope does not represent any physical quantity, so there we analyze the slope to check whether one quantity is increasing or decreasing with change in other quantity.

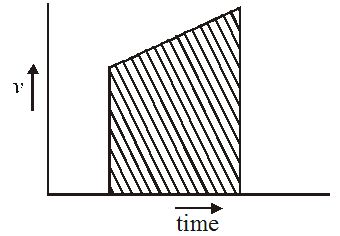
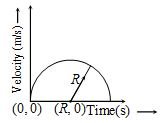
(4) Area bounded by graph with x axis is of great importance as it may also represent a physical quantity.

In case of standard shape like square, rectangle or circle the area can be calculated directly using formula of their area. While in case the equation of graph is given we can find the area by integration.

\displaystyle \text{Area between graph and x axis = }\int\limits_{{{{x}_{1}}}}^{{{{x}_{2}}}}{{f(x).dx}}

Important graphs in kinematics
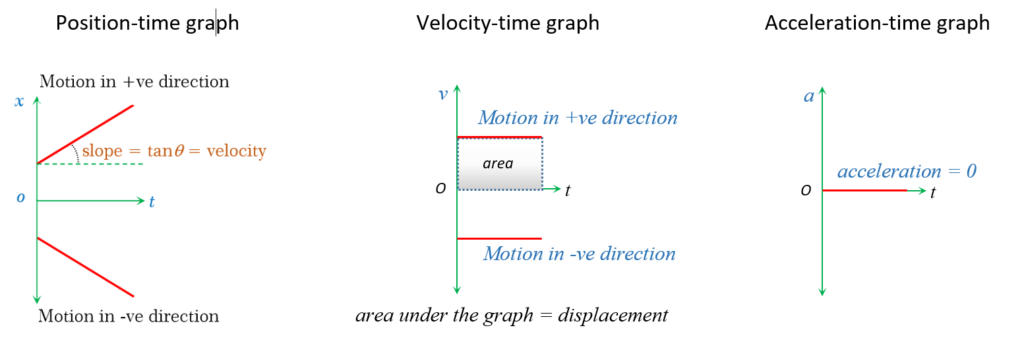
Uniform Motion

Nonuniform Motion With Constant Acceleration

As we know that the graphs are made according to the equations therefore we should consider the equations of motion to draw the graphs in kinematics.

The three equations and their types with nature of graph are given below.

1.

\displaystyle S=ut+\frac{1}{2}a{{t}^{2}}

It is a quadratic equation 

The S-t graph is a parabola symmetrical to displacement axis

2.

\displaystyle v=u+at

It is a linear equation 

The v-t graph is a straight line with slope equal to acceleration

3.

\displaystyle {{v}^{2}}={{u}^{2}}+2aS

It is a quadratic equation 

The v-S graph is a parabola symmetrical to displacement axis

Equation of displacement for accelerated motion in +ve direction

\displaystyle S=ut+\frac{1}{2}a{{t}^{2}}

so it is a parabola in 1st quadrant as shown above

Equation of displacement for accelerated motion in  -ve direction

\displaystyle S=-ut-\frac{1}{2}a{{t}^{2}}

so it is a parabola in 4th quadrant as shown above

Equation of velocity for accelerated motion in +ve direction

\displaystyle v=u+at

so it is a straight line with +ve slope in 1st quadrant as shown above

Equation of velocity for accelerated motion in  -ve direction

\displaystyle v=-u-at

so it is a straight line with   -ve slope in 4th quadrant as shown above

As acceleration is constant therefore in any case the acceleration vs time graph must follow the equation 

\displaystyle a=\text{constant}

Hence it is always be a straight line parallel to time axis

Practice Questions (Basic Level)

1.

The graph between velocity and acceleration for a uniformly accelerated motion must be a 

(a) Straight line with positive slope

(b) Straight line parallel to velocity axis

(c) Straight line parallel to acceleration axis

(d) Parabola symmetrical to acceleration axis

Ans.  (b)

2.

The displacement of a body depends on the fourth power of time. Then

(a) The body must be in nonuniform motion

(b) The body must have motion with varying velocity

(c) The acceleration vs time graph must be a parabola

(d) All of the above

Ans.  (d)


Practice Questions (JEE Main Level)

1.

The velocity of a body increases for some time, then attains a constant value and finally the velocity decreases until the body stops. What will be the shape of the velocity – time graph?

(a)  Straight line        (b)  Square                  (c)  Circle                (d)  Trapezium

Ans.   (d)

2.

The following figures show velocity  versus time t curves. But only some of these can be realized in practice. These are

(a) a, b and d only          (b)  a, b and c only          (c)  b, d only            (d)  All     

Ans.   (c)

3.

A particle starts from rest and moves along a straight line with constant acceleration. The variation of velocity  with displacement S is

Ans-(b)

4.

Which of the following represents the time-displacement graph of two moving objects P and Q which are moving with zero relative speed?

Ans-(b)

5.

A graph of acceleration versus time of a particle starting from rest at t = 0 is as shown in figure. The speed of the particle at t = 14s is

(a) \mathbf{2}\,\,\mathbf{m}{{\mathbf{s}}^{{-\mathbf{1}}}}                              (b) \mathbf{34}\,\,\mathbf{m}{{\mathbf{s}}^{{-\mathbf{1}}}}                      (c) \mathbf{20}\,\,\mathbf{m}{{\mathbf{s}}^{{-\mathbf{1}}}}             (d) \mathbf{42}\,\,\mathbf{m}{{\mathbf{s}}^{{-\mathbf{1}}}} 

Ans.   (b)

6.

The graph in figure shows the velocity  v versus time t for a body. Which of the graphs shown in figure represents the corresponding acceleration versus time graphs?

Ans-(d)

7.

The displacement time graph of a moving particle is shown below. The instantaneous velocity of the particle is negative at the point

(a) C        (b) D        (c)  E          (d)  F

Ans.   (c)

8.

In the given v-t graph, the distance traveled by the body in 4 second will be

(a)     20 m                     (b)  50 m                         (c)  80 m                 (d)  70 m

Ans.   (d)

9.

The displacement time graph of two moving particles make angles of 30° and 45° with the x–axis. The ratio of the two velocities is

(a) \sqrt{3}:1    (b)1 : 1         (c) 1 : 2       (d) 1:\sqrt{3}

Ans.   (d)

10.

What does the shaded portion in figure represent?

(a)     Momentum       (b)  Acceleration          (c)  Distance         (d)  Velocity

Ans.   (c)

11.

The velocity-time graph of a body is shown in figure. The ratio of the…………. during the intervals OA and AB is ………….

(a)  Average velocities;1                                  

(b) OA/OB;1/4

(c)  Average accelerations; same as distances covered

(d)  Distance covered;

Ans.   (a)

12.

From the v versus t graph of figure find

(i) the time(s) at which the particle is at rest;

(ii) at what time if any, the particle reverses the direction of its motion

(a) 3s; 3s                         (b) 3s; 2s

(c) 3s; 4s                         (d) 4s ; 2s

Ans:(a) 

13.

A train moves from one station to another in two hours. Its speed during the motion is shown in the graph. Calculate maximum acceleration during the journey

(a) 160 km/h2       (b) 180 km/h2       (c) 170 km/h2         (d) 150 km/h2    

Ans:(a)        

14.

A rocket is fired vertically upwards with a net acceleration of 4 m/s2 and initial velocity zero. After 5 second its fuel is finished and it decelerates with g. At the highest point its velocity becomes zero. Then it accelerates downwards with acceleration g and return back to ground. Displacement-time graph for the complete journey is (Take g = 10 m/s2 )

Ans:(b)

15    Plot acceleration time graph of figure shown.

Ans:(a)

16.

Acceleration –time graph of a particle moving in a straight line is as shown in figure. At time t = 0, velocity of the particle is zero. Average acceleration in the time interval from t = 6 s to t = 12 s is

(a) 5 m/s2          (b) 10 m/s2                (c) 2.5 m/s2                (d) 20 m/s2

Ans:(b)

17.

The figure shows displacement versus time graph for a particle moving along x-axis. Find the average velocity in the interval 4s to 7s is

(a) 3.0 m/s               (b) –3.3 m/s                    (c) 10 m/s                  (d) 2.5 m/s

Ans:(d)

18.

Use the v versus t graph of figure to estimate the average speed for the first 6s.

(a) 3.28 m/s             (b) 2.59 m/s             (c) 4.67 m/s              (d) 5.83 m/s

Ans:(c)

19.

Figure shows the velocity versus time history of two cars moving along the same road. If both cars started at the same point together, at what later time do they have the same) position?

(a) 1 s            (b) 2 s                 (c) 4 s                     (d) 3 s

Ans:(c)

20.

A particle starts from rest and moves on a straight line. The acceleration of the particle varies with time as shown in the figure. Find the velocity and displacement of the particle at t = 4s.

(a) 5 m/s, 7 m       (b) 2 m/s, 12 m         (c) 3 m/s, 6 m        (d) 4 m/s, 6 m

Ans:(a)

Practice Questions (JEE Advance Level)

1.

Velocity-time graph of a particle is in the shape of a semicircle of radius R as shown in figure.

Its average acceleration from T = 0 to T = R is:     

a) 0 m/s2                           (b) 1 m/s2                            

(c) R m/s2                          (d) 2R m/s2

Ans-(b)

2.

Each of the three graphs represents acceleration versus time for an object that has a positive velocity at time t1. Graphs showing the object with increasing speed in the interval t1 to t2 are        

(a) graph I, only       

(b) graphs I and II, only 

(c) graphs I and III,only 

(d) graphs I, II, and III

Ans-(d)

3.

The slope of the velocity displacement graph of a particle moving along a straight line is
10 unit at a position where velocity is 5 unit. The acceleration of the particle at that position is

(a) 50 unit                    (b) 5 unit                     (c) 10 unit                    (d) 2 unit

Ans-(a)

4.

The acceleration of a particle which moves along the positive x-axis varies with its position as shown. If  the velocity of  the particle is 0.8 m/s at x = 0 , the velocity (in m/s) of the  particle  at  x = 1.4 is


(a) 1.6            (b) 1.2              (c) 1.4                    (d) none of these

Ans-(b)

Equation of displacement for accelerated motion in +ve direction

\displaystyle S=ut+\frac{1}{2}a{{t}^{2}}

Equation of displacement for accelerated motion in  -ve direction

\displaystyle S=-ut-\frac{1}{2}a{{t}^{2}}