Lorem ipsum dolor sit amet, consectetur adipiscing elit. Ut elit tellus, luctus nec ullamcorper mattis, pulvinar dapibus leo.
Practice Questions (Level-1)
Lorem ipsum dolor sit amet, consectetur adipiscing elit. Ut elit tellus, luctus nec ullamcorper mattis, pulvinar dapibus leo.
Practice Questions (Level-2)
1.
The velocity of a body increases for some time, then attains a constant value and finally the velocity decreases until the body stops. What will be the shape of the velocity – time graph?
(a) Straight line (b) Square (c) Circle (d) Trapezium
Ans. (d)
2.
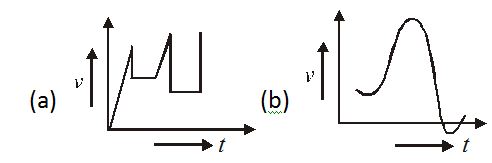
The following figures show velocity versus time t curves. But only some of these can be realized in practice. These are
(a) a, b and d only (b) a, b and c only (c) b, d only (d) All
Ans. (c)
3.
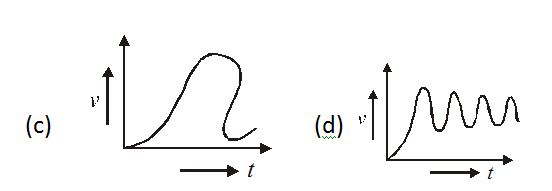
A particle starts from rest and moves along a straight line with constant acceleration. The variation of velocity with displacement S is
Ans-(b)
4.
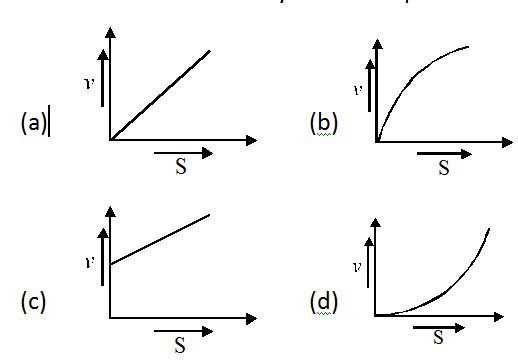
Which of the following represents the time-displacement graph of two moving objects P and Q which are moving with zero relative speed?
Ans-(b)
5.
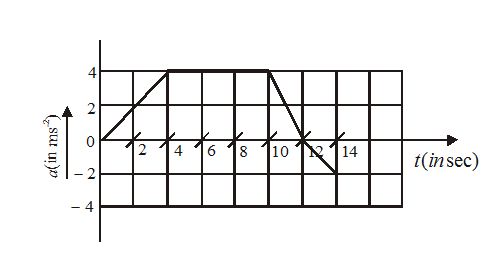
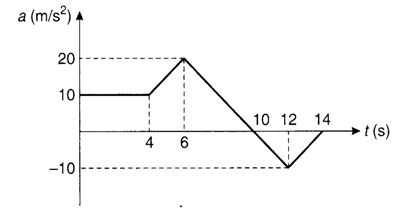
A graph of acceleration versus time of a particle starting from rest at t = 0 is as shown in figure. The speed of the particle at t = 14s is
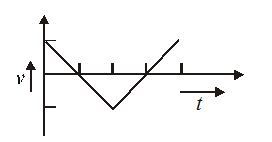
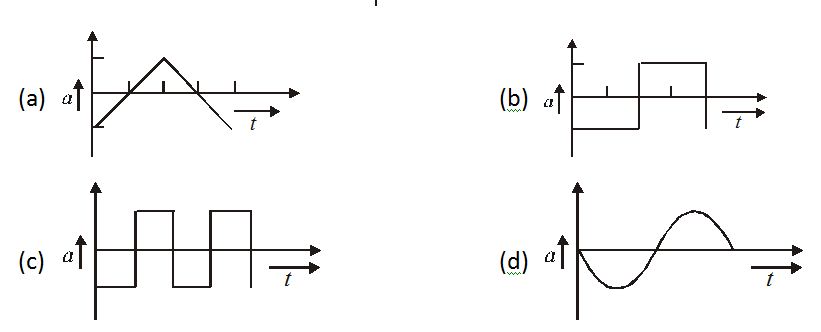
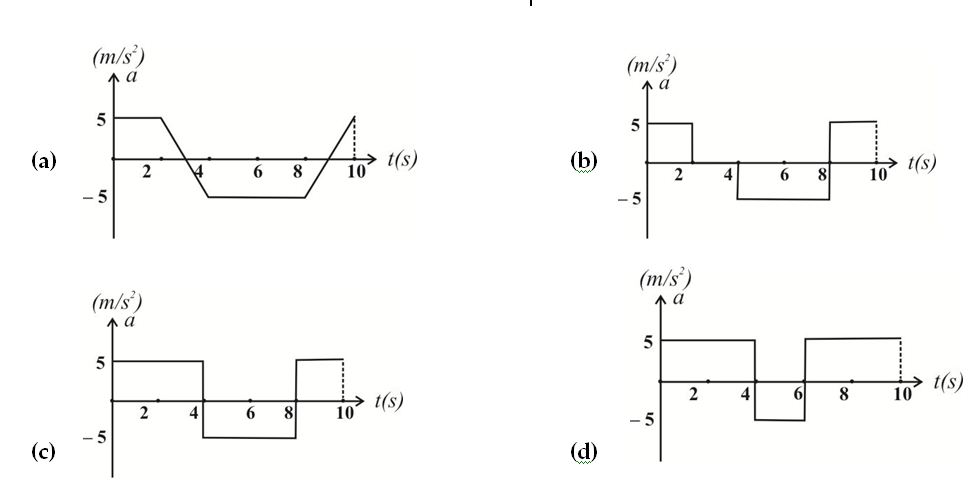
The graph in figure shows the velocity v versus time t for a body. Which of the graphs shown in figure represents the corresponding acceleration versus time graphs?
Ans-(d)
7.
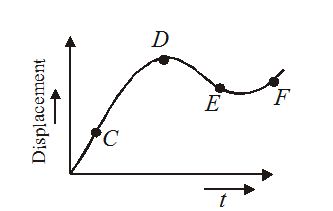
The displacement time graph of a moving particle is shown below. The instantaneous velocity of the particle is negative at the point
(a) C (b) D (c) E (d) F
Ans. (c)
8.
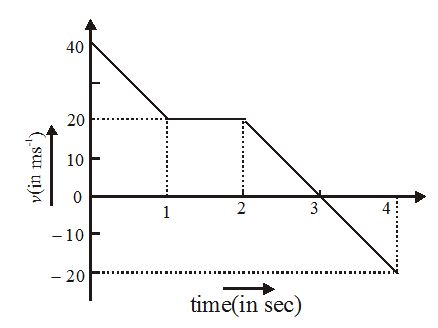
In the given v-t graph, the distance traveled by the body in 4 second will be
(a) 20 m (b) 50 m (c) 80 m (d) 70 m
Ans. (d)
9.
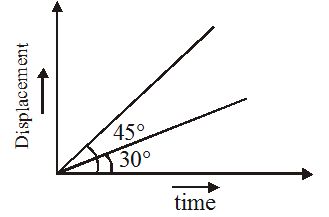
The displacement time graph of two moving particles make angles of 30° and 45° with the x–axis. The ratio of the two velocities is
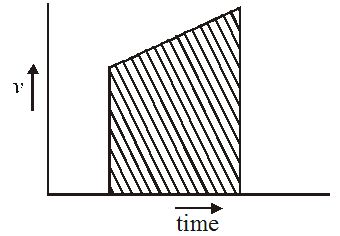
The velocity-time graph of a body is shown in figure. The ratio of the…………. during the intervals OA and AB is ………….
(a) Average velocities;1
(b) OA/OB;1/4
(c) Average accelerations; same as distances covered
(d) Distance covered;
Ans. (a)
12.
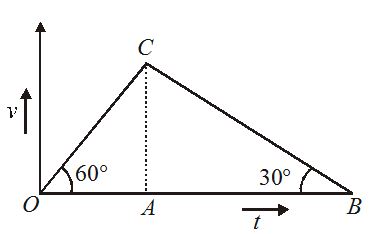
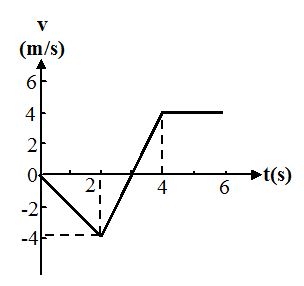
From the v versus t graph of figure find
(i) the time(s) at which the particle is at rest;
(ii) at what time if any, the particle reverses the direction of its motion
(a) 3s; 3s (b) 3s; 2s
(c) 3s; 4s (d) 4s ; 2s
Ans:(a)
13.
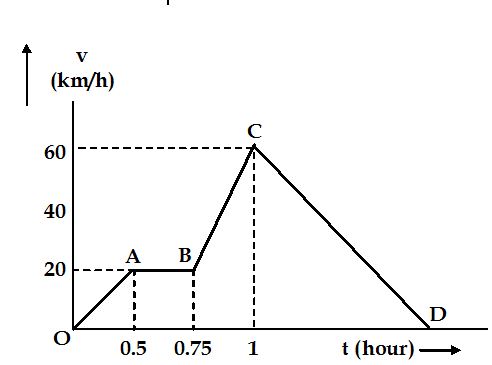
A train moves from one station to another in two hours. Its speed during the motion is shown in the graph. Calculate maximum acceleration during the journey
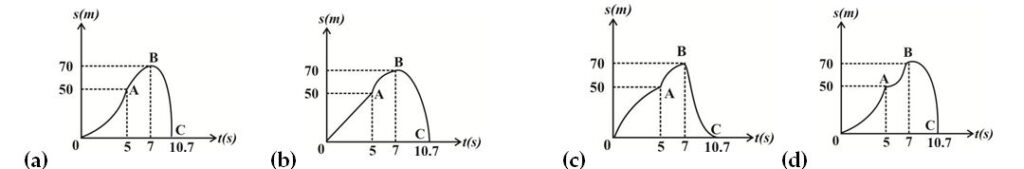
A rocket is fired vertically upwards with a net acceleration of 4 m/s2 and initial velocity zero. After 5 second its fuel is finished and it decelerates with g. At the highest point its velocity becomes zero. Then it accelerates downwards with acceleration g and return back to ground. Displacement-time graph for the complete journey is (Take g = 10 m/s2 )
Ans:(b)
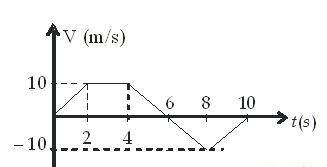
15 Plot acceleration time graph of figure shown.
Ans:(a)
16.
Acceleration –time graph of a particle moving in a straight line is as shown in figure. At time t = 0, velocity of the particle is zero. Average acceleration in the time interval from t = 6 s to t = 12 s is
(a) 5 m/s2 (b) 10 m/s2 (c) 2.5 m/s2 (d) 20 m/s2
Ans:(b)
17.
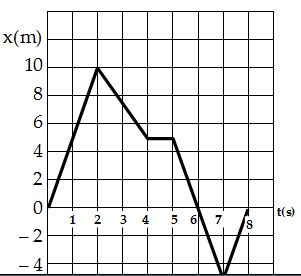
The figure shows displacement versus time graph for a particle moving along x-axis. Find the average velocity in the interval 4s to 7s is
(a) 3.0 m/s (b) –3.3 m/s (c) 10 m/s (d) 2.5 m/s
Ans:(d)
18.
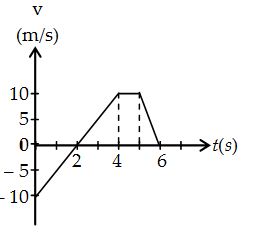
Use the v versus t graph of figure to estimate the average speed for the first 6s.
(a) 3.28 m/s (b) 2.59 m/s (c) 4.67 m/s (d) 5.83 m/s
Ans:(c)
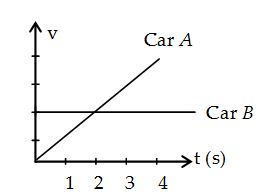
19.
Figure shows the velocity versus time history of two cars moving along the same road. If both cars started at the same point together, at what later time do they have the same) position?
(a) 1 s (b) 2 s (c) 4 s (d) 3 s
Ans:(c)
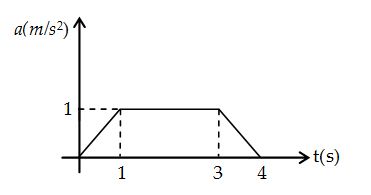
20.
A particle starts from rest and moves on a straight line. The acceleration of the particle varies with time as shown in the figure. Find the velocity and displacement of the particle at t = 4s.
(a) 5 m/s, 7 m (b) 2 m/s, 12 m (c) 3 m/s, 6 m (d) 4 m/s, 6 m